안드로이드 스튜디오 만나기
Meet Android Studio
In this document
안드로이드 스튜디오는 IntelliJ의 IDEA를 기반으로, 안드로이드 app을 개발하기 위한 공식 통합 개발환경(IDE)입니다.
IntelliJ의 강력한 코드 편집기 및 개발자 도구의 위에서, 안드로이드 스튜디오는 안드로이드 app을 만들 때 생산성을 높여주는 아래와 같은 많은 기능을 제공합니다:
Android Studio is the official Integrated Development Environment (IDE) for Android app development, based on
. On top of IntelliJ's powerful code editor and developer tools, Android Studio offers even more features that enhance your productivity when building Android apps, such as:
- 유연한 Gradle-기반 빌드 시스템 A flexible Gradle-based build system
- 신속하고 기능이 풍부한 에뮬레이터 A fast and feature-rich emulator
- 모든 안드로이드 장치에 대하여 개발할 수 있는 통합된 환경
A unified environment where you can develop for all Android devices - 새로 APK를 빌딩하지 않고도 실행 중인 app을 변경시키는 인스턴트 Run
Instant Run to push changes to your running app without building a new APK - 공통의 app 기능 구축과 샘플 코드의 import를 도와주는, 코드 템플릿과 깃허브 통합
Code templates and GitHub integration to help you build common app features and import sample code - 확장적인 테스팅 도구 및 프레임웍 Extensive testing tools and frameworks
- 성능, 사용성, 버전 호환성, 기타 문제를 해결하기 위한 lint 도구들
Lint tools to catch performance, usability, version compatibility, and other problems - C++ and NDK support
- Built-in support for Google Cloud Platform, making it easy to integrate Google Cloud Messaging and App Engine
이 페이지에서는 기본적인 안드로이드 스튜디오 기능을 소개합니다.
최근 변경된 사항은 Android Studio Release Notes를 참조하세요.
This page provides an introduction to basic Android Studio features. For a summary of the latest changes, see Android Studio Release Notes.
프로젝트 구조 Project Structure

Figure 1. The project files in Android view.
안드로이드 스튜디오 내의 각 프로젝트는 소스코드 파일과 리소스 파일을 가진 1개 이상의 모듈을 포함하고 있습니다.
모듈의 타입들은 아래를 포함하고 있습니다:
Each project in Android Studio contains one or more modules with source code files and resource files. Types of modules include:
- 안드로이드 app 모듈
Android app modules - 라이브러리 모듈
Library modules - Google App Engine modules
기본적으로, 안드로이드 스튜디오는 그림1과 같이 안드로이드 프로젝트 view에 프로젝트 파일을 열거합니다.
이 view는 프로젝트의 주요 소스 파일에 빠르게 접근할 수 있도록 모듈들로 구성되어 있습니다.
By default, Android Studio displays your project files in the Android project view, as shown in figure 1. This view is organized by modules to provide quick access to your project's key source files.
모든 빌드 파일은 Gradle Scripts의 톱 레벨에서 보이며, 각 app 모듈은 다음의 폴더를 포함하고 있습니다:
All the build files are visible at the top level under Gradle Scripts and each app module contains the following folders:
- manifests:
AndroidManifest.xml파일을 포함.
manifests: Contains theAndroidManifest.xmlfile. - java: JUnit test 코드가 포함된 자바 소스코드 파일을 포함.
java: Contains the Java source code files, including JUnit test code. - res: XML layouts, UI strings, bitmap images등 코드가 아닌 모든 리소스를 포함.
res: Contains all non-code resources, such as XML layouts, UI strings, and bitmap images.
디스크의 안드로이드 프로젝트 구조는 평평한 이 표현과 다릅니다.
프로젝트의 실제 파일 구조를 확인하려면, 프로젝트 드롭다운에서 프로젝트를 선택합니다
(그림1, Android로 보이는).
The Android project structure on disk differs from this flattened representation. To see the actual file structure of the project, select Project from the Project dropdown (in figure 1, it's showing as Android).
또한 app 개발의 특정 측면에 초점을 맞추기 위하여 프로젝트 파일의 view를 사용자가 조정 할 수 있습니다.
예를 들어, 프로젝트의 Problems view를 선택하면, 레이아웃 파일에서 태그를 닫는 태그를 닫는 XML엘리먼트의 누락과 같은, 인식된 코딩 및 신택스 오류를 포함하는 소스 파일에 대한 링크를 표시합니다.
You can also customize the view of the project files to focus on specific aspects of your app development. For example, selecting the Problems view of your project displays links to the source files containing any recognized coding and syntax errors, such as a missing XML element closing tag in a layout file.

Figure 2. The project files in Problems view, showing a layout file with a problem.
For more information, see Managing Projects.
사용자 인터페이스 The User Interface
안드로이드 스튜디오 메인 창은 그림3과 같이 몇 개의 논리적 영역으로 구성되어 있습니다.
The Android Studio main window is made up of several logical areas identified in figure 3.

Figure 3. The Android Studio main window.
- toolbar는 app 실행과 안드로이드 도구 론칭을 포함한, 넓은 범위의 액션을 수행할 수 있게 해줍니다.
The toolbar lets you carry out a wide range of actions, including running your app and launching Android tools. - navigation bar 는 프로젝트에 걸쳐 navigate하는 것을 도와주고 editing을 위하여 파일을 열어줍니다.
navigation bar는 Project 도구 창에서 보이는 보다 간결한 구조의 view를 제공합니다.
The navigation bar helps you navigate through your project and open files for editing. It provides a more compact view of the structure visible in the Project tool window. - editor window는 코드를 만들고 수정하는 곳입니다.
현행 file 타입에 따라, 이 창은 변경될 수 있습니다.
예를 들어, layout 파일을 viewing 할 때, editor window는 layout editor를 나열하고, 해당 XML 파일을 보기 위한 옵션을 제공합니다.
The editor window is where you create and modify code. Depending on the current file type, this window can change. For example, when viewing a layout file, the editor window displays the layout editor and offers the option to view the corresponding XML file. - Tool windows에서는 project 관리, search, version control 등과 같은 특정 태스크에 접근할 수 있습니다.
Tool windows을 확장할 수도 있고 collapse 할 수도 있습니다.
Tool windows give you access to specific tasks like project management, search, version control, and more. You can expand them and collapse them. - The status bar displays the status of your project and the IDE itself, as well as any warnings or messages.
You can organize the main window to give yourself more screen space by hiding or moving toolbars and tool windows. You can also use keyboard shortcuts to access most IDE features.
At any time, you can search across your source code, databases, actions, elements of the user interface, and so on, by double-pressing the Shift key, or clicking the magnifying glass in the upper right-hand corner of the Android Studio window. This can be very useful if, for example, you are trying to locate a particular IDE action that you have forgotten how to trigger.
Tool Windows
Instead of using preset perspectives, Android Studio follows your context and automatically brings up relevant tool windows as you work. By default, the most commonly used tool windows are pinned to the tool window bar at the edges of the application window.
- To expand or collapse a tool window, click the tool’s name in the tool window bar. You can also drag, pin, unpin, attach, and detach tool windows.
- To return to the current default tool window layout, click Window > Restore Default Layout or customize your default layout by clicking Window > Store Current Layout as Default.
- To show or hide the entire tool window bar, click the window icon
 in the bottom left-hand corner of the Android Studio window.
 - To locate a specific tool window, hover over the window icon and select the tool window from the menu.
You can also use keyboard shortcuts to open tool windows. Table 1 lists the shortcuts for the most common windows.
Table 1. Keyboard shortcuts for some useful tool windows.
| Tool Window | Windows and Linux | Mac |
|---|---|---|
| Project | Alt+1 | Command+1 |
| Version Control | Alt+9 | Command+9 |
| Run | Shift+F10 | Control+R |
| Debug | Shift+F9 | Control+D |
| Android Monitor | Alt+6 | Command+6 |
| Return to Editor | Esc | Esc |
| Hide All Tool Windows | Control+Shift+F12 | Command+Shift+F12 |
If you want to hide all toolbars, tool windows, and editor tabs, click View > Enter Distraction Free Mode. This enables Distraction Free Mode. To exit Distraction Free Mode, click View > Exit Distraction Free Mode.
You can use Speed Search to search and filter within most tool windows in Android Studio. To use Speed Search, select the tool window and then type your search query.
코드 완성 Code Completion
안드로이드 스튜디오는 3가지 타입의 코드완성을 갖고 있는데, 키보드 쇼컷을 사용하여 접근할 수 있습니다.
Android Studio has three types of code completion, which you can access using keyboard shortcuts.
Table 2. Keyboard shortcuts for code completion.
| Type | Description | Windows and Linux | Mac |
|---|---|---|---|
| Basic Completion | 변수, types, methods, expressions 등에 대한 기본적 제시를 보여줍니다. 한 행에서 basic completion를 두 번 호출하면, private members와 non-imported static members등 보다 많은 결과가 나타납니다. Displays basic suggestions for variables, types, methods, expressions, and so on. If you call basic completion twice in a row, you see more results, including private members and non-imported static members. |
Control+Space | Control+Space |
| Smart Completion | Displays relevant options based on the context. Smart completion is aware of the expected type and data flows. If you call Smart Completion twice in a row, you see more results, including chains. | Control+Shift+Space | Control+Shift+Space |
| Statement Completion | Completes the current statement for you, adding missing parentheses, brackets, braces, formatting, etc. | Control+Shift+Enter | Shift+Command+Enter |
You can also perform quick fixes and show intention actions by pressing Alt+Enter.
For more information about code completion, see Code Completion.
Navigation
Here are some tips to help you move around Android Studio.
- Switch between your recently accessed files using the Recent Files action. Press Control+E (Command+E on a Mac) to bring up the Recent Files action. By default, the last accessed file is selected. You can also access any tool window through the left column in this action.
- View the structure of the current file using the File Structure action. Bring up the File Structure action by pressing Control+F12 (Command+F12 on a Mac). Using this action, you can quickly navigate to any part of your current file.
- Search for and navigate to a specific class in your project using the Navigate to Class action. Bring up the action by pressing Control+N(Command+O on a Mac). Navigate to Class supports sophisticated expressions, including camel humps, paths, line navigate to, middle name matching, and many more. If you call it twice in a row, it shows you the results out of the project classes.
- Navigate to a file or folder using the Navigate to File action. Bring up the Navigate to File action by pressing Control+Shift+N (Command+Shift+O on a Mac). To search for folders rather than files, add a / at the end of your expression.
- Navigate to a method or field by name using the Navigate to Symbol action. Bring up the Navigate to Symbol action by pressing Control+Shift+Alt+N(Command+Shift+Alt+O on a Mac).
- Find all the pieces of code referencing the class, method, field, parameter, or statement at the current cursor position by pressing Alt+F7.
Style and Formatting
편집이 진행되면, Android Studio는 자동적으로 code style settings에 규정된 대로 포맷팅과 스타일을 적용합니다.
tabs와 indents, spaces, wrapping과 braces 그리고 blank lines에 대한 컨벤션 규정을 포함하여, 프로그래밍 언어로 코드 스타일 세팅을 사용자가 조정할 수 있습니다.
code style settings을 사용자가 조정하려면, File > Settings > Editor > Code Style 을 클릭하면 됩니다( 맥에서는 Android Studio > Preferences > Editor > Code Style).
As you edit, Android Studio automatically applies formatting and styles as specified in your code style settings. You can customize the code style settings by programming language, including specifying conventions for tabs and indents, spaces, wrapping and braces, and blank lines. To customize your code style settings, click File > Settings > Editor > Code Style (Android Studio > Preferences > Editor > Code Style on a Mac.)
Although the IDE automatically applies formatting as you work, you can also explicitly call the Reformat Code action by pressing Control+Alt+L(Opt+Command+L on a Mac), or auto-indent all lines by pressing Control+Alt+I (Alt+Option+I on a Mac).
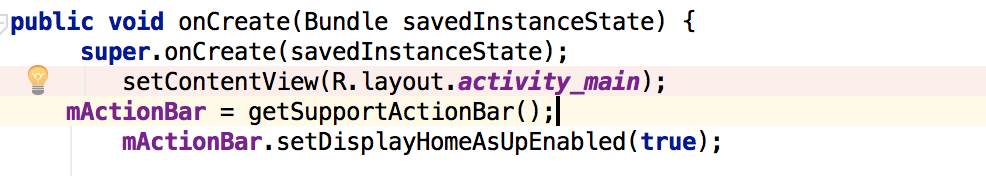
Figure 4. Code before formatting.
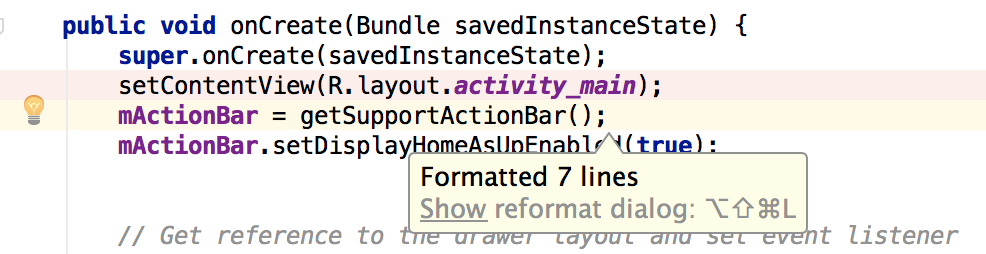
Figure 5. Code after formatting.
Version Control Basics
Android Studio supports a variety of version control systems (VCS’s), including Git, GitHub, CVS, Mercurial, Subversion, and Google Cloud Source Repositories.
After importing your app into Android Studio, use the Android Studio VCS menu options to enable VCS support for the desired version control system, create a repository, import the new files into version control, and perform other version control operations:
- From the Android Studio VCS menu, click Enable Version Control Integration.
- From the drop-down menu, select a version control system to associate with the project root, and then click OK.
The VCS menu now displays a number of version control options based on the system you selected.
Note: You can also use the File > Settings > Version Control menu option to set up and modify the version control settings.
Gradle Build System
Android Studio는 빌드 시스템의 토대로, Android Plugin for Gradle가 제공하는 보다 많은 안드로이드-중심 기능을 가진 Gradle을 사용합니다.
이 build 시스템은 Android Studio 메뉴로부터 통합된 도구로 가동되며, command line과는 독립적입니다.
다음을 수행하기 위하여 빌드 시스템의 기능을 사용할 수 있습니다:
Android Studio uses Gradle as the foundation of the build system, with more Android-specific capabilities provided by the Android Plugin for Gradle. This build system runs as an integrated tool from the Android Studio menu, and independently from the command line. You can use the features of the build system to do the following:
- 빌드 프로세스를 사용자가 조정하고, 컨피규어하고, 확장.
- 동일한 프로젝트와 모듈을 사용하여 서로 다른 기능을 가진, app을 위한 복수의 APK를 만들기
Create multiple APKs for your app, with different features using the same project and modules. - 소소셋트에 걸쳐 코드와 리소스를 재사용하기
Reuse code and resources across sourcesets.
By employing the flexibility of Gradle, you can achieve all of this without modifying your app's core source files. Android Studio build files are namedbuild.gradle. They are plain text files that use Groovy syntax to configure the build with elements provided by the Android plugin for Gradle. Each project has one top-level build file for the entire project and separate module-level build files for each module. When you import an existing project, Android Studio automatically generates the necessary build files.
To learn more about the build system and how to configure, see Configure Your Build.
Build Variants
The build system can help you create different versions of the same application from a single project. This is useful when you have both a free version and a paid version of your app, or if you want to distribute multiple APKs for different device configurations on Google Play.
For more information about configuring build variants, see Configuring Gradle Builds.
APK Splits
APK splits allow you to efficiently create multiple APKs based on screen density or ABI. For example, APK splits allow you to create separate hdpi and mdpi versions of an app while still considering them a single variant and allowing them to share a test app, javac, dx, and ProGuard settings.
For more information about using APK Splits, read APK Splits.
Resource Shrinking
Resource shrinking in Android Studio automatically removes unused resources from your packaged app and library dependencies. For example, if your application is using Google Play services to access Google Drive functionality, and you are not currently using Google Sign-In, then resource shrinking can remove the various drawable assets for theSignInButton buttons.
Note: Resource shrinking works in conjunction with code shrinking tools, such as ProGuard.
For more information on shrinking code and resources, see Shrink Your Code and Resources.
Managing Dependencies
Dependencies for your project are specified by name in the build.gradle file. Gradle takes care of finding your dependencies and making them available in your build. You can declare module dependencies, remote binary dependencies, and local binary dependencies in your build.gradle file. Android Studio configures projects to use the Maven Central Repository by default. (This configuration is included in the top-level build file for the project.) For more information about configuring dependencies, read Configure Build Variants.
Debug and Profile Tools
Android Studio assists you in debugging and improving the performance of your code, including inline debugging and performance analysis tools.
Inline debugging
Use inline debugging to enhance your code walk-throughs in the debugger view with inline verification of references, expressions, and variable values. Inline debug information includes:
- Inline variable values
- Referring objects that reference a selected object
- Method return values
- Lambda and operator expressions
- Tooltip values

Figure 6. An inline variable value.
To enable inline debugging, in the Debug window, click Settings
![]()
and select the checkbox for Show Values Inline.
Performance monitors
Android Studio provides performance monitors so you can more easily track your app’s memory and CPU usage, find deallocated objects, locate memory leaks, optimize graphics performance, and analyze network requests. With your app running on a device or emulator, open the Android Monitortool window, and then click the Monitors tab.
For more information about performance monitors, see Android Monitor.
Heap dump
When you’re monitoring memory usage in Android Studio, you can simultaneously initiate garbage collection and dump the Java heap to a heap snapshot in an Android-specific HPROF binary format file. The HPROF viewer displays classes, instances of each class, and a reference tree to help you track memory usage and find memory leaks.
For more informatin about working with heap dumps, see Dumping and Analyzing the Java Heap.
Allocation tracker
Android Studio allows you to track memory allocation as it monitors memory use. Tracking memory allocation allows you to monitor where objects are being allocated when you perform certain actions. Knowing these allocations enables you to optimize your app’s performance and memory use by adjusting the method calls related to those actions.
For information about tracking and analyzing allocations, see Allocation Tracker.
Data file access
The Android SDK tools, such as Systrace, logcat, and Traceview, generate performance and debugging data for detailed app analysis.
To view the available generated data files, open the Captures tool window. In the list of the generated files, double-click a file to view the data. Right-click any .hprof files to convert them to the standard .hprof file format.
Code inspections
Whenever you compile your program, Android Studio automatically runs configured Lint and other IDE inspections to help you easily identify and correct problems with the structural quality of your code.
The Lint tool checks your Android project source files for potential bugs and optimization improvements for correctness, security, performance, usability, accessibility, and internationalization.

Figure 7. The results of a Lint inspection in Android Studio.
In addition to Lint checks, Android Studio also performs IntelliJ code inspections and validates annotations to streamline your coding workflow.
For more information, see Improving Your Code with Lint and lint tool.
Annotations in Android Studio
Android Studio supports annotations for variables, parameters, and return values to help you catch bugs, such as null pointer exceptions and resource type conflicts. The Android SDK Manager packages the Support-Annotations library in the Android Support Repository for use with Android Studio. Android Studio validates the configured annotations during code inspection.
For more details about Android annotations, see Improving Code Inspection with Annotations.
Log messages
When you build and run your app with Android Studio, you can view adb output and device log messages (logcat) by clicking Android Monitor at the bottom of the window.
If you want to debug your app with the Android Device Monitor, you can launch the Device Monitor by clicking Tools > Android > Android Device Monitor. The Device Monitor is where you can find the complete set of DDMS tools for profiling your app, controlling device behaviors, and more. It also includes the Hierarchy Viewer tool to help optimize your layouts.
'User Guide' 카테고리의 다른 글
| 프로젝트 관리 Manage Your Project (6) (0) | 2016.06.01 |
|---|---|
| 개발자 워크플로우 기본 Developer Workflow Basics (5) (0) | 2016.06.01 |
| IDE와 도구 업데이트 하기 Update the IDE and Tools (4) (0) | 2016.06.01 |
| 안드로이드 스튜디오 컨피규어 하기 Configure Android Studio (3) (0) | 2016.06.01 |
| Migrate to Android Studio from Eclipse (2) (0) | 2016.06.01 |


댓글